Understanding Learning and Experience Curves in Project Risk Analysis
- Eric Torkia
- Sep 26
- 3 min read

This post introduces three popular learning curve methods for estimating how a person, team, or organization benefits from forecasting repeat learning:
Wright’s Curve
Crawford’s Curve
The Experience Curve
These techniques are essential tools for the project risk analyst when forecasting costs, productivity, and efficiency improvements over time.
The old adage “practice makes perfect” applies perfectly here. What’s even more fascinating is that decades of research show that learning tends to follow a fairly predictable, constant rate.
Wright’s Learning Curve (1936)
The Wright approach assumes that each time production doubles, unit cost decreases by a constant percentage. This percentage is the learning rate (LR).
Formula for cumulative cost of producing N units:

Wright’s model is straightforward and often used when unit-by-unit tracking is important.
Crawford’s Learning Curve
Crawford refined Wright’s approach by focusing on lots of units instead of individual units. The midpoint of a lot is used to estimate average cost for that lot, which makes the model more practical for batch or production planning.
Starting point for each lot:

To calculate cumulative totals or averages, the formula must be applied iteratively across all lots:
Cumulative Average = sum of lot averages ÷ total units
Cumulative Total = sum of all lot averages
Crawford’s curve is more conservative than Wright’s, as it accounts for batch effects.
The Experience Curve (BCG, 1960s)
The Experience Curve, popularized by the Boston Consulting Group, generalizes learning beyond labor efficiency to include technology, scale, and process improvements.
The analytic form:
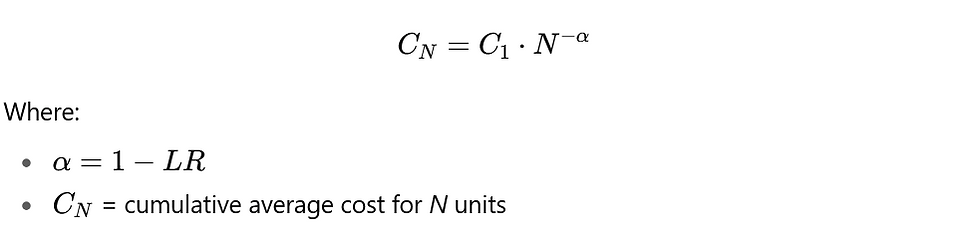
This model emphasizes that not just workers, but entire systems and organizations, improve with repetition. It’s often applied at the strategic or industry level (e.g., predicting cost reductions across energy, technology, or manufacturing sectors).
Rules of Thumb for Learning Rates
When historical data is unavailable, rules of thumb can guide curve selection. From Stewart’s Cost Estimator’s Reference Manual (2nd Ed.):
75% hand assembly / 25% machining → 80% LR
50% hand assembly / 50% machining → 85% LR
25% hand assembly / 75% machining → 90% LR
By industry:
IT Projects: 85–95% (varies greatly)
Aerospace: 85%
Shipbuilding: 80–85%
Complex machine tools (new models): 75–85%
Repetitive electronics: 90–95%
Repetitive machining / punch-press: 90–95%
Electrical operations: 75–85%
Welding operations: 90%
Raw materials: 93–96%
Purchased parts: 85–88%
Example: 80% Learning Rate
The chart and table below show how the three methods differ when applied to an 80% curve with a first-unit cost of $50.
Wright’s Curve: optimistic, assumes steady improvement at doubling points.
Crawford’s Curve: conservative, more realistic for lot production.
Experience Curve: strategic view, capturing broader system improvements.

Final Thoughts
As always, the right choice depends on the context, data availability, and the level of conservatism required. Each method has its place:
Wright for simple forecasting
Crawford for lot-based production analysis
Experience for strategic, industry-wide cost forecasting
If you’d like to explore applying learning and experience curves to your project planning, drop me a line at etorkia@crystalballservices.com
Sources & References
Eric Torkia, Decision Superhero Vol. 2, chapter 6 : SuperPower: The Laws of Nature that Predict, Technics Publishing, 2025
Available on Amazon : https://a.co/d/4YlJFzY . Volumes 2 and 3 to be released in Spring and Fall 2025.
Wright, T.P. (1936). Factors Affecting the Cost of Airplanes. Journal of the Aeronautical Sciences, 3(4), 122–128.
Henderson, B.D. (1973). Industrial Experience, Technology Transfer, and Cost Behavior. Harvard Business School Working Paper.
Crawford, D. (1982). Learning Curves: Theory and Practice. Journal of Cost Analysis.


Comments